Sometimes my interests intersect. I've been working on a way to plot
markers and objects onto real-world charts.
The charts in question are the Tactical Pilotage Charts
(1:500,000) and Operational Navigation Charts (1:1,000,000); these are
used for civilian and some military air navigation, and so focus on
terrain altitudes and features recognisable from the air. Current
charts are vastly expensive, but a fairly complete set from the late
1980s and early 1990s is available from the
Map Collection of the
Perry-Castañeda Library at the University of Texas:
here are the TPCs, and
here are the ONCs.
I'm going to go into a fair bit of technical detail, but first: why am
I doing this? (Beyond the obvious: for playing Harpoon or other games,
e.g. by email, with limited information available to the players.) Two
reasons. One is to use real world locations with some degree of
accuracy; while many published scenarios for Harpoon are set in
generic open sea, quite a few are not. A scenario map, such as the
ones found in
this PDF,
tends to be a pretty rough affair, and is hard to translate into
something directly gameable, whereas with the charts one can get a
much greater degree of detail. The other reason is visual appeal, and
this is why I'm using these particular charts rather than tiles from
OpenStreetMap (which would be much simpler as there's continuous
world-wide coverage, so I wouldn't need to think about individual map
sheets): the aviation charts "feel" more relevant to the situation
than a general-purpose map. (Maritime charts would be even better, of
course, but there's no free source for those that I'm aware of, and
many areas aren't covered at all.)
The scans aren't perfect; there are places where what should be
straight lines suddenly jump sideways an arcminute or two, presumably
because of a crease or tear in the original. But they're decently high
resolution, to the point where a single map sheet can be around
sixteen megabytes in size and 9000×6000 pixels. (Fortunately for a
modern computer it's generally not a problem to view an image this
large in a web browser, either zoomed out to get a general impression
or zoomed in to view detail.) The full TPC set is around ten
gibibytes, while the ONC set is about 3.4. Another downside is that
there are no charts of areas that contain no land.
Also, these don't use a simple projection. They work on the
Lambert conformal conic
projection, and coping with that is what the meat of this post is
about. I wrote my code in Perl, but I'll avoid specificities of
programming language here.
This projection shows parallels of latitude as curved lines, and
parallels of longitude as straight lines. I therefore made a
simplifying abstraction: I treat the LCC as a form of polar
coordinates, where latitude is the distance r from the north pole
and longitude is the angle θ from some arbitrary meridian. There's
some error in the longitude conversion by using this method, but it's
less than the errors already in the scan.
This then is the basis for the conversion. I measure four points on
the map, three along a parallel of latitude (conventionally the edge
nearest the pole) and one along a (conventionally leftmost) parallel
of longitude, and store both their latitude and longitude (read from
the map) and their pixel x and y coordinates.
From the points at the same latitude, I generate the pixel coordinates
xc and yc of the centre of the latitude circle (where the pole would
be, if one were foolish enough to extend this map that far); this is
of course a long way off the actual map. There are multiple methods
for doing this, and your language's geometry library may already have
one; failing that, either take the perpendicular bisectors of the
lines between two of the pairs of points and find their intersection,
or generate three simultaneous equations of the form
(xn-xc)²+(yn-yc)²=R², where (xn,yn) are individual points on the
circumference, and solve for R, xc and yc.
Then it's just a matter of generating linear conversions (of the form
y=a+bx): one converts latitude in degrees to the r distance in
pixels from the virtual pole (based on first and fourth points), while
the other converts longitude in degrees to a useful θ, based on
first and third points. At this point plotting a latitude/longitude
location becomes a simple matter of converting polar to Cartesian
coordinates (and of course the process is reversible).
I've played a fair bit of computer Harpoon, so I plot with the NTDS
symbology, more or less as seen
here,
though I don't use the "carrier" symbol. It's fairly easy to pick up,
and at least mildly authentic.
So here is HMS Coventry in San Carlos Water, coming under attack by a
pair of Skyhawks. The heavy circles on land are small airfields.
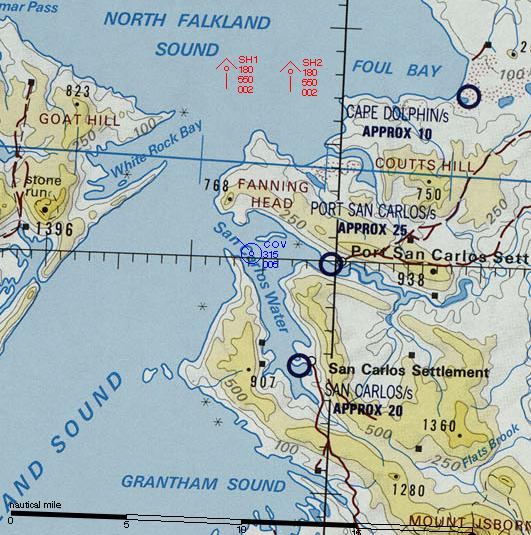
Everything that gets plotted on the map is defined in terms of
latitude and longitude coordinates rather than X and Y. This makes
calculations of ranges and bearings somewhat more involved, but for
Perl at least there's the excellent Geo::Ellipsoid module that does
all the heavy lifting.
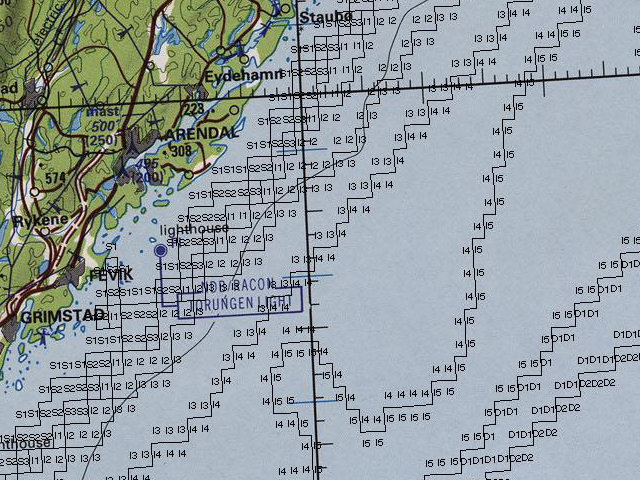
Since Harpoon gaming often involves submarines, I was very happy to
find the
ETOPO1 dataset from
the NOAA. This is a free, arcminute-resolution, data set of global
elevations, including sea depths. It's not perfect, but it's a usable
abstraction that's easy to add to a map plot (here I'm converting
depth to Harpoon's bands, off the southern coast of Norway in the
midst of the Skagerrak).
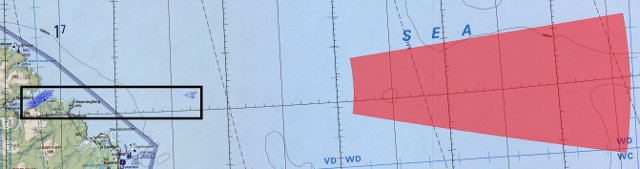
It's also possible to plot circles, boxes, and arbitrary paths (which
can include arc segments as well as straight lines). Here's a setup
map for the Battles of the Third World War scenario The Russians
Are Coming, where the Russian start zone in the Barents Sea is
described as "from 30 to 80 nautical miles from [the Norwegian ship
Nordkapp], between bearings 080 and 100". (The black box surrounds all
units that a player knows about, his own and any detected enemies, and
is used as an aid for getting one's bearings on the full map.) Click
image for full-size view.
Comments on this post are now closed. If you have particular grounds for adding a late comment, comment on a more recent post quoting the URL of this one.